If you want to design a homemade UltraViolet LED exposure box, you have come to the right place.
The following plot was generated with Python. On the right is the 2D projection that the LEDs will illuminate on the perpendicular surface. The idea is to modify the number of LEDs to cover as much area as possible to properly “cure” the photoresistive layer of the PCB.
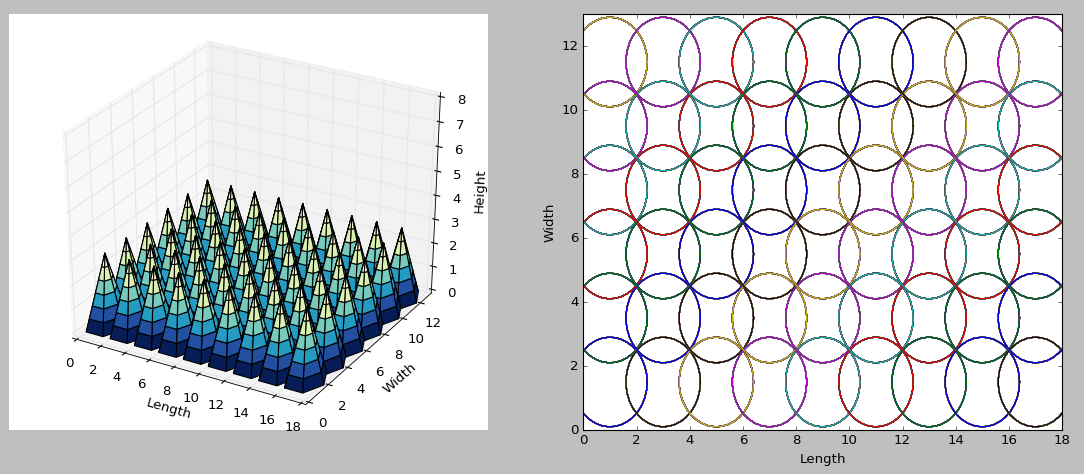
With this code, you could calculate the minimum height from the UV LEDs to the perpendicular surface of the photoresistive film of the PCB to fully expose the surface. The only parameters you need to change are the box’s height, length and width, the aperture angle of the LEDs (theta) and the number of LEDs (x) parallel to the length. The number of LEDs parallel to the width are automatically calculated and stored in y. The second output is the minimum height where you have to place the LEDs.
The Code
##===================================================================================
##  Simple LED UV Box design
##  Written By: AG Miranda
##  Date: 2016/01/13 yyyy/mm/dd
##===================================================================================
import math as math
import matplotlib.pyplot as plt
from mpl_toolkits.mplot3d import Axes3D
import numpy as np
from matplotlib import cm

##Givens
H = 8   #Box's height
L = 18  #Box's Length
W = 13  #Box's Width
theta = 25
x = 9

##Calculations
d = L/(2 * x)
x_center = (L - x * 2 * d)/2

y = W /(2*d)
y = int(y)
y_center = (W - y * 2 * d)/2

theta = math.radians(theta)
h = d * math.cos(theta) / math.sin(theta)

if h > H:
    print('Error: The minimum height is higher than the box''s height: ' + repr(h) + ' > ' + repr(H))
else:
    print('The minimum height is: ' + repr(h))

## Design Re-adjustment
h = h * 1.4 # works pretty well
proj_d = h * math.sin(theta) / math.cos(theta)
if h > H:
    print('Error: The minimum height is higher than the box''s height: ' + repr(h) + ' > ' + repr(H))
else:
    print('The Rule-of-Thumb height is: ' + repr(h))

##Plot related
points = 7  # number of sides = points - 1
fig = plt.figure()
ax = fig.add_subplot(121, projection='3d')
ax2 = fig.add_subplot(122)
plt.hold(True)

##>For the 3D plot
##>> Polar Coordinates
r = np.linspace(0, proj_d, points)
phi = np.linspace(0, 2*np.pi, points)
R, P = np.meshgrid(r, phi)
##>>Cartesian system transformation
X, Y = R*np.cos(P), R*np.sin(P)
Z = np.linspace(h, 0, points)

##>For the 2D plot
##>>Create a circle
points_2d = 36
r_2d = np.linspace(proj_d, proj_d, points_2d)
phi_2d = np.linspace(0, 2*np.pi, points_2d)
R_2d, P_2d = np.meshgrid(r_2d, phi_2d)
X_2d, Y_2d = R_2d*np.cos(P_2d), R_2d*np.sin(P_2d)

## Graphing ALL plots
for i in range(x):
    for j in range(y):
        ax.plot_surface(X+d*(i*2+1), Y+d*(j*2+1)+y_center, Z, rstride=1, cstride=1, cmap=cm.YlGnBu_r)
        ax2.plot(X_2d+d*(i*2+1), Y_2d+d*(j*2+1)+y_center)

ax.set_xlim3d(0, L)
ax.set_ylim3d(0, W)
ax.set_zlim3d(0, H)
ax.set_xlabel('Length')
ax.set_ylabel('Width')
ax.set_zlabel('Height')

ax2.set_xlim(0, L)
ax2.set_ylim(0, W)
ax2.set_xlabel('Length')
ax2.set_ylabel('Width')

plt.show()